All content on this site is intended for healthcare professionals only. By acknowledging this message and accessing the information on this website you are confirming that you are a healthcare professional. If you are a patient or carer, please visit Know ALL.
The ALL Hub website uses a third-party service provided by Google that dynamically translates web content. Translations are machine generated, so may not be an exact or complete translation, and the ALL Hub cannot guarantee the accuracy of translated content. The ALL Hub and its employees will not be liable for any direct, indirect, or consequential damages (even if foreseeable) resulting from use of the Google Translate feature. For further support with Google Translate, visit Google Translate Help.


The ALL Hub is an independent medical education platform, sponsored by Amgen and Autolus. Funders are allowed no direct influence on our content. The levels of sponsorship listed are reflective of the amount of funding given. View funders.
Now you can support HCPs in making informed decisions for their patients
Your contribution helps us continuously deliver expertly curated content to HCPs worldwide. You will also have the opportunity to make a content suggestion for consideration and receive updates on the impact contributions are making to our content.
Find out more
Create an account to access:
Bookmark & personalize site content
Receive alerts for new content in your areas of interest
View ALL content recommended for you
Association between pharmacogenomics and treatment response in childhood ALL
Acute lymphoblastic leukemia (ALL) is the most common cancer in childhood with marked heterogeneity of somatic genomic phenotypes. The ALL Hub has previously reported on novel subtypes of ALL in the context of early treatment response as measured by minimal residual disease-directed (MRD) therapy. Although contemporary chemotherapy for childhood ALL is tailored based on clinical features, leukemia somatic genomic aberrations, and MRD; the inter-patient variability in MRD and relationships between somatic genomics and drug resistance phenotypes are poorly understood.1
Here, we summarize a recent publication in Nat Med by Lee et al.1 evaluating the relationship between molecular subtypes and treatment response in children with newly diagnosed ALL.1
Methods1
Design
This study included 805 children and adolescents with ALL from St. Jude Children’s Research Hospital, treated on 3 consecutive ALL total therapy protocols: TOTXV (NCT00137111), TOTXVI (NCT00549848), and TOTXVII (NCT03117751).
The key objectives were to perform ex-vivo pharmacotyping of contemporary chemotherapeutic drugs for primary ALL cells, comprehensively characterize drug response profiles across molecular subtypes in childhood ALL, evaluate the association of drug sensitivities with MRD, and explore the pharmacotyping-based subgrouping of ALL and its impact on survival outcomes.
Genomic profiling, MRD, and determination of genetic ancestry
- Leukemia cells were collected and subjected to drug sensitivity profiling ex vivo for a panel of 18 therapeutic agents for ALL (cytarabine, mercaptopurine, nelarabine, thioguanine, daunorubicin, dexamethasone, prednisolone, vincristine, l-asparaginase, bortezomib, CHZ868, dasatinib, ibrutinib, ruxolitinib, trametinib, panobinostat, vorinostat, and venetoclax).
- MRD levels were determined by flow cytometry in the middle of induction (Day 15 MRD) on Day 15 (TOTXVI and TOTXVII), Day 19 (TOTXV), and at the end of remission induction (Day 42 MRD) on Days 42–46.
- Genetic ancestry was estimated by comparing the allele frequencies of germline single-nucleotide polymorphisms with reference populations from the 1000 Genomes Project.
Pharmacotyping of primary ALL cells
- Drug profiling was performed via in vitro 3-(4,5-dimethylthiazol-2-yl)-2,5-diphenyl tetrazolium bromide drug resistance assay or mesenchymal stem cell co-culture system assay with flow cytometry.
- The sensitivity of ALL cells across the entire population, specific ALL subtypes, and MRD was compared using 5,447 50% lethal concentration (LC50) measurements.
- Correlations of single-drug LC50 with Day 15 (mid-induction) or Day 42 (post-induction) MRD were assessed using multiple linear regression. Coefficient of linear regression (β) was evaluated where each unit change in coefficient represented a unit change of MRD (log10− transformed), where a coefficient of 1.0 indicated a tenfold increase of MRD.
RNA-sequencing and ALL subtype analysis
- RNA-sequencing was performed for each patient to determine the following 23 molecular subtypes by
- rearrangements (BCR-ABL1, ETV6-RUNX1, KMT2A, TCF3-PBX1, DUX4, ZNF384, MEF2D, intrachromosomal amplification of chromosome 21 [iAMP21], BCL2/MYC, NUTM1, CRLF2, and HLF);
- aneuploidy (hyperdiploid [chromosome number ≥51], low hypodiploid [chromosome number 31–39] and near haploid [chromosome number 24–30]);
- gene expression profiles (ETV6-RUNX1-like, PAX5alt and BCR-ABL1-like); and
- sequence mutations (PAX5 P80R and IKZF1N159Y).
Results1
The baseline patient characteristics are shown in Table 1.
Table 1. Baseline patient characteristics*
|
Characteristic, % (unless otherwise stated) |
N = 805 |
|---|---|
|
ETP, early T-cell precursor; NCI, National Cancer Institute; WBC, while blood cell. |
|
|
Sex |
|
|
Male |
54.7 |
|
Female |
45.3 |
|
Age group (years) |
|
|
<1 |
6.7 |
|
1 to <10 |
74.9 |
|
≥10 |
24.2 |
|
NCI criteria |
|
|
Standard risk |
57.8 |
|
High risk |
42.2 |
|
WBC count at diagnosis (×109/L) |
|
|
<50 |
74.0 |
|
≥50 |
26.0 |
|
Population and ancestry |
|
|
European |
66.0 |
|
African |
12.9 |
|
Admixed American |
12.2 |
|
Other |
8.1 |
|
Unknown |
0.9 |
|
Subtype |
|
|
ETV6-RUNX1 |
23.6 |
|
Hyperdiploid |
22.1 |
|
T-cell ALL (non-ETP) |
14.0 |
|
B Other |
7.3 |
|
PAX5alt |
4.5 |
|
DUX4 |
4.2 |
|
KMT2A |
4.0 |
|
TCF3-PBX1 |
3.7 |
|
BCR-ABL1 |
2.6 |
|
CRLF2 (BCR-ABL1-like) |
2.6 |
|
ETP |
2.0 |
|
ETV6-RUNX1-like |
1.7 |
|
BCR-ABL1-like (excluding CRLF2) |
1.6 |
|
iAMP21 |
1.1 |
|
MEF2D |
1.1 |
|
Near haploid |
1.0 |
|
ZNF384 |
1.0 |
|
NUTM1 |
0.6 |
|
PAX5 P80R |
0.4 |
|
Low hypodiploid |
0.2 |
|
TCF3-HLF |
0.2 |
|
BCL2/MYC |
0.1 |
|
IKZF1 N159Y |
0.1 |
Association of clinical features with ALL drug sensitivity
- Across all included drugs, a wide inter-individual variability in drug sensitivity was observed, with an average coefficient of variation of 55.3% (range, 8.7–105.4%).
- LC50 distribution revealed significant differences in prednisolone and asparaginase by age, mercaptopurine and dasatinib by white blood cell count at diagnosis, and asparagine by NCI risk group (Figure 1). There were no differences in drug LC50 by sex or ancestry.
Figure 1. LC50 of each drug across A age, B NCI risk group, and C WBC at diagnosis (×109/L)*
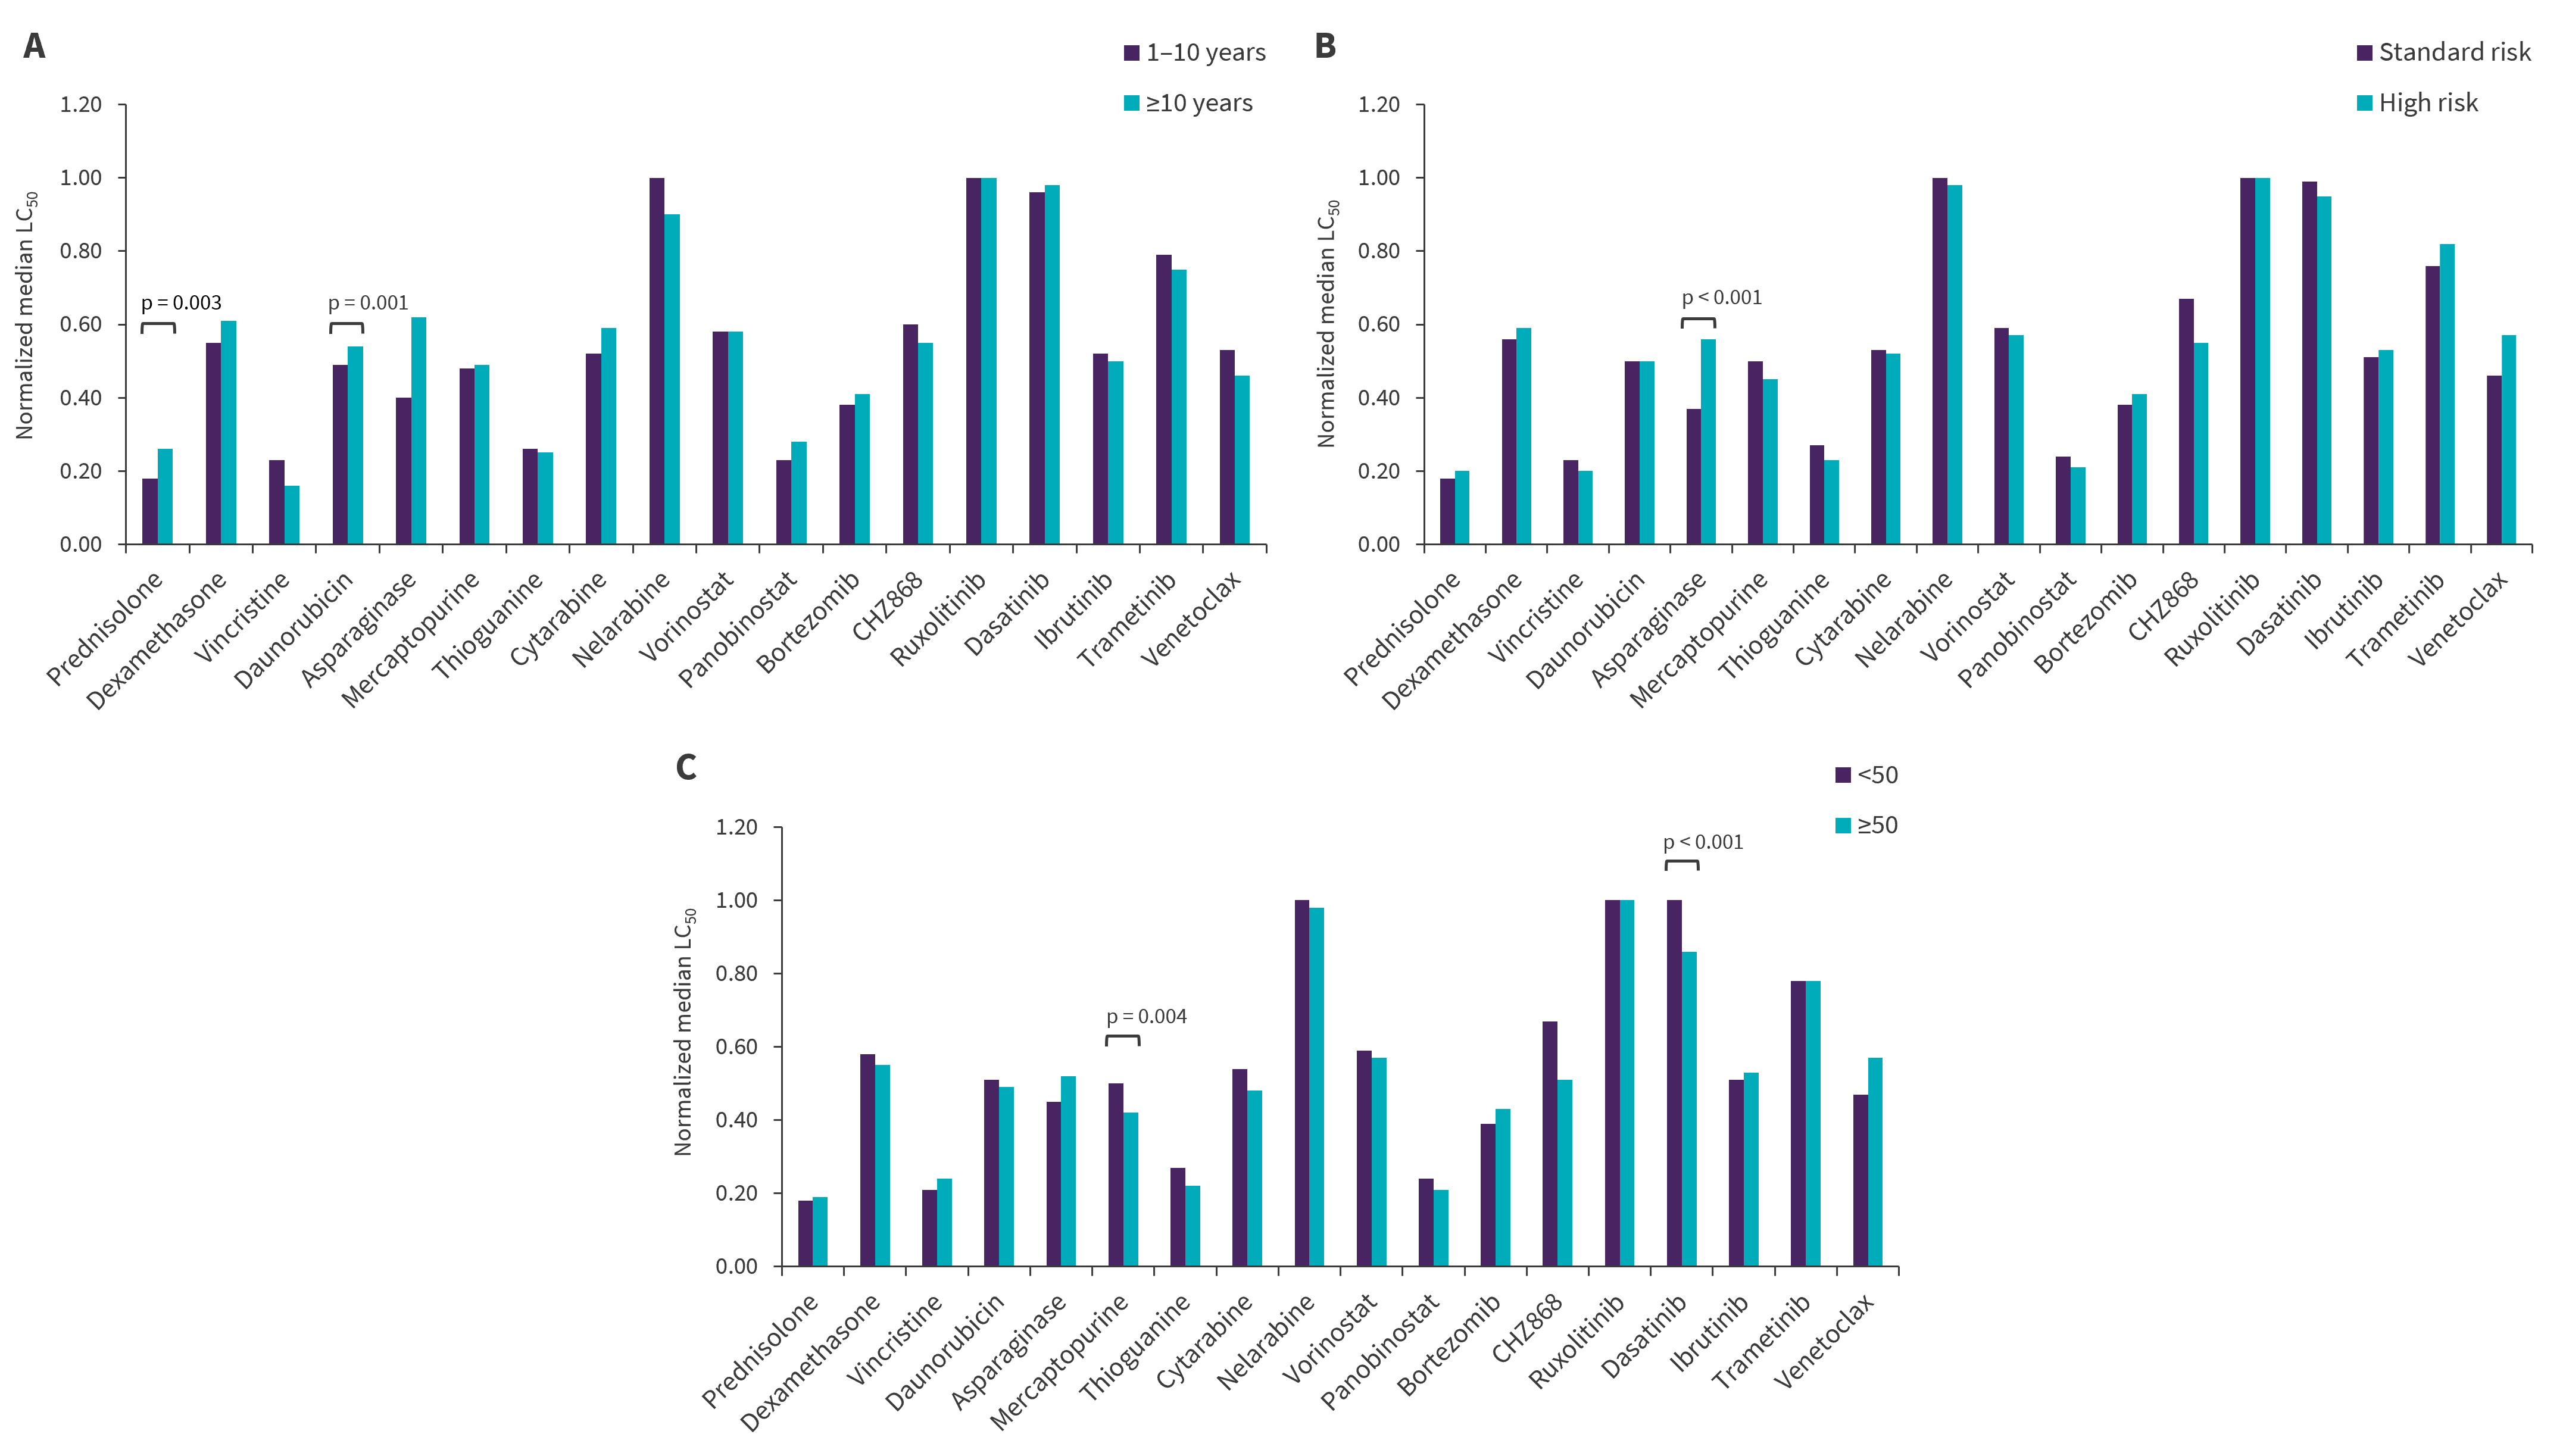
LC50, 50% lethal concentration; NCI, National Cancer institute; WBC, white blood cell.
*Adapted from Lee, et al.1
Drug sensitivity across ALL subtypes
Except for panobinostat, ruxolitinib, bortezomib, and daunorubicin, all drugs exhibited nominally significant inter-subtype variability (p < 0.05).
- ETV6-RUNX1 and hyperdiploid ALL were highly sensitive to the four drugs commonly used in remission induction (prednisolone, vincristine, daunorubicin and L-asparaginase [PVDL]), with median PVDL LC50 of 0.18 for ETV6-RUNX1 and 0.26 for hyperdiploid, both significantly lower than the remaining subtypes (LC50, 0.41; p < 0.001 and p = 0.004, respectively).
- BCR-ABL1, BCR-ABL1-like, and KMT2A, being subtypes with poorer prognosis, exhibited a higher PVDL LC50 of 0.46 (p = 0.001), 0.66 (p < 0.001), and 0.54 (p < 0.001), respectively, compared with ETV6-RUNX1. DUX4, a recently identified subtype, exhibited an intermediate PVDL LC50 of 0.33.
A high subtype-dependent pattern of sensitivities to targeted agents was observed.
- Hyperdiploidy was significantly more sensitive (p < 0.001) to venetoclax than non-hyperdiploidy.
- High sensitivities to dasatanib were observed in T-cell ALL compared with non T-cell ALL (LC50, 0.20; p < 0.001), TCF3-PBX1 compared with non-TCF3-PBX1 (LC50, 0.28; p = 0.013), and BCR-ABL1 compared with non-BCR-ABL1 (LC50, 0; p < 0.001).
- NUTM1 had a low LC50 for several antimetabolites compared with non-NUTM1 subtypes: 0.09 for cytarabine (p = 0.007), 0.16 for mercaptopurine (p = 0.002), and 0 for thioguanine (p = 0.0003).
Association of ALL ex-vivo drug sensitivity with MRD
- In patients with B-ALL, L-asparaginase, prednisolone, dexamethasone, and mercaptopurine were positively correlated with MRD at both Day 15 and Day 42, while thioguanine and cytarabine were only associated with Day 15 MRD (Figure 2).
- In patients with T-cell ALL, panobinostat and dasatinib were positively correlated with Day 15 MRD, while venetoclax showed a negative association with Day 15 MRD. Nelarabine was positively correlated with Day 42 MRD.
Figure 2. Correlation of A B-ALL and B T-ALL drug sensitivities with MRD during induction therapy*
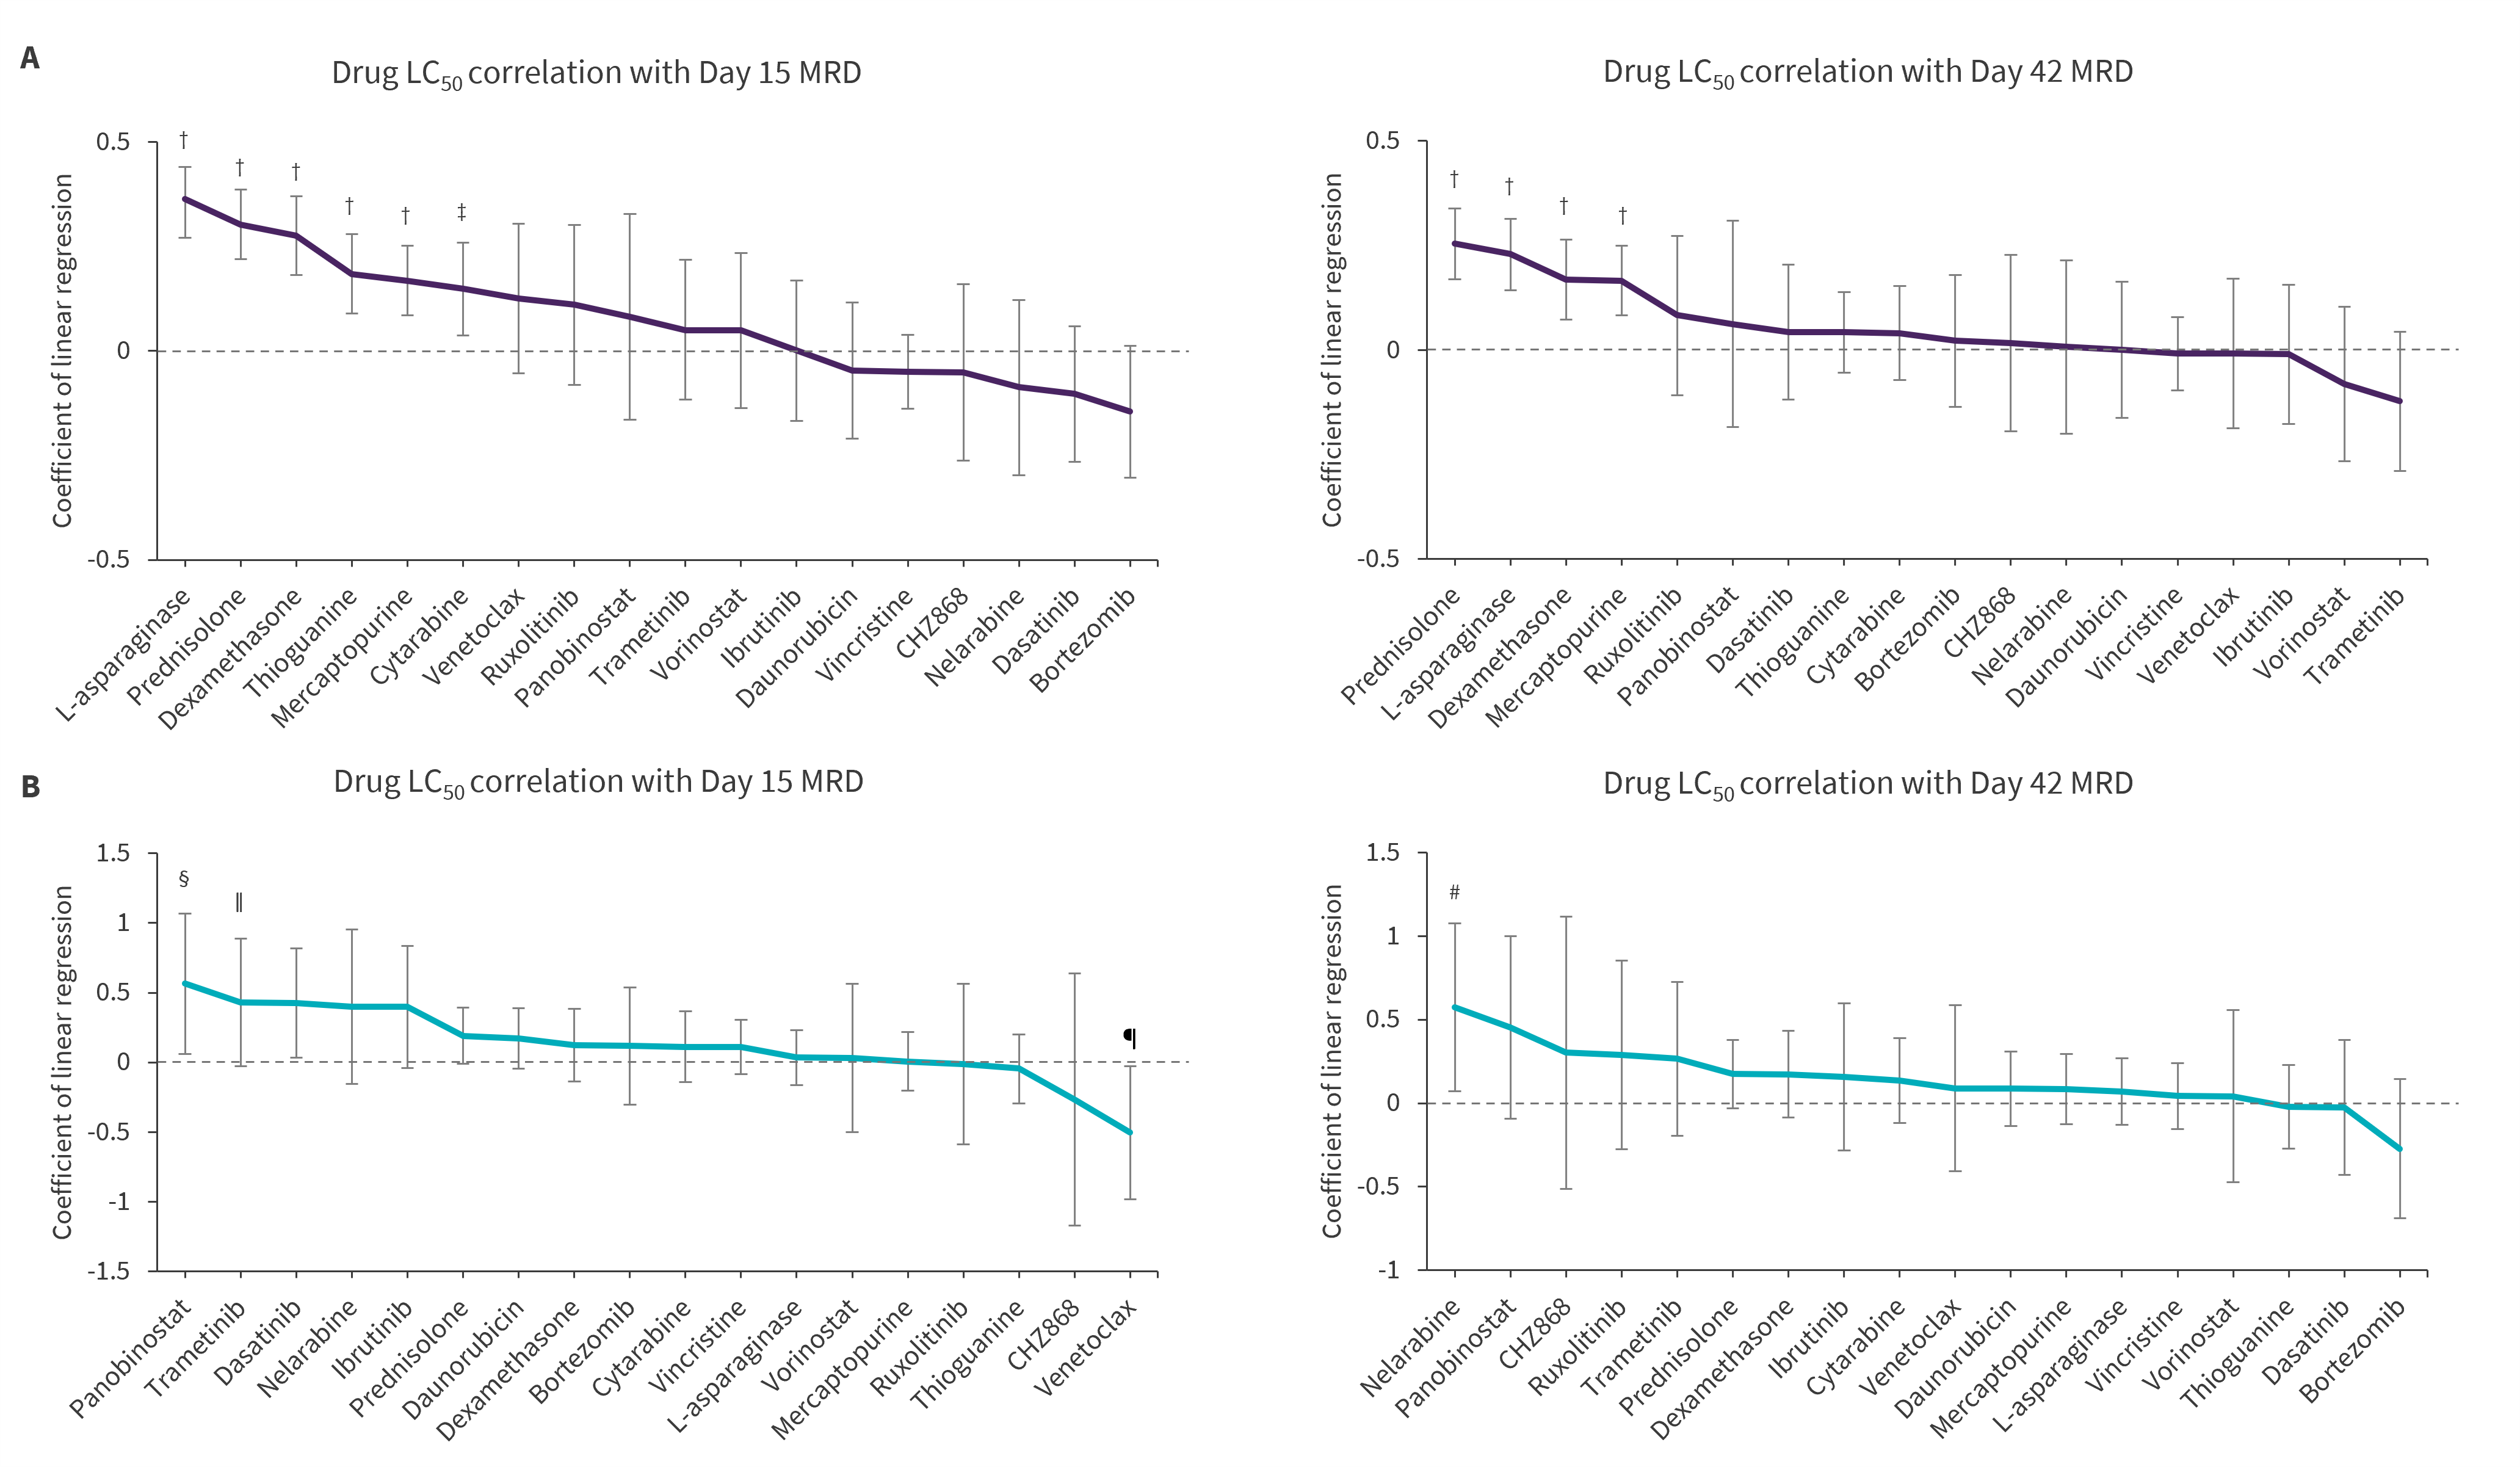
ALL, acute lymphoblastic leukemia; LC50, 50% lethal concentration; MRD, minimal residual disease.
*Adapted from Lee, et al.1
†p < 0.001.
‡p = 0.009.
§p = 0.028.
ǁp = 0.034.
¶p = 0.039.
#p = 0.025.
Pharmacotypes define distinct ALL subsets and prognosis
Supervised hierarchical clustering analysis revealed six clusters of ALL cases with unique patterns of drug response and genetic phenotypes (Figure 3).
Figure 3. Distinct ALL patient clusters*
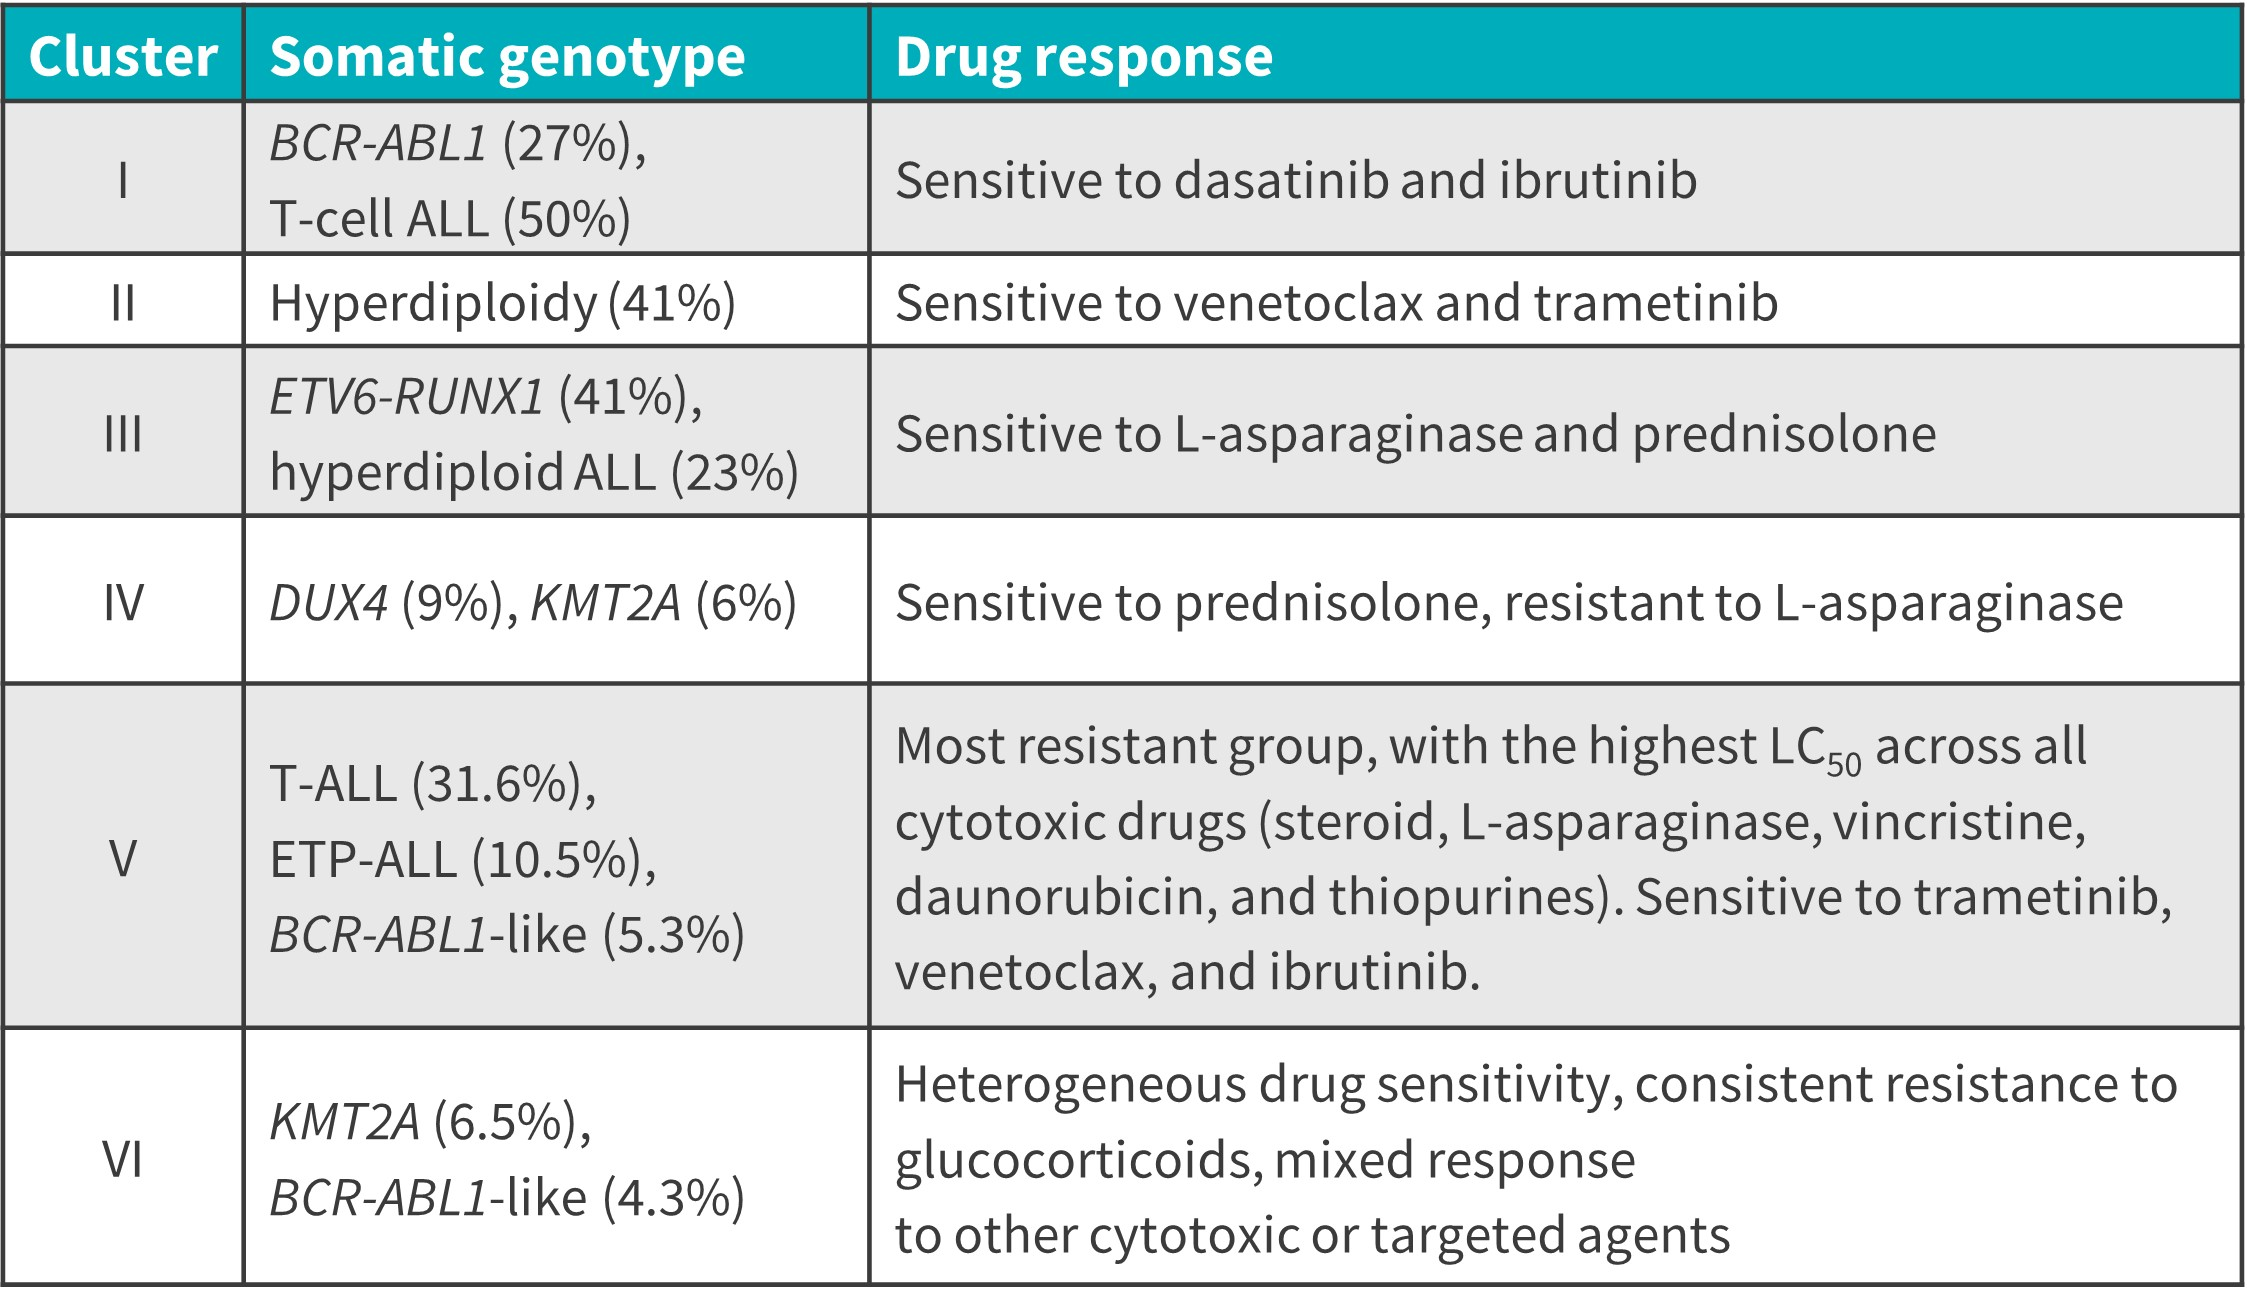
ALL, acute lymphoblastic leukemia; ETP, early T-cell precursor.
*Adapted from Lee, et al.1
Event-free survival differed significantly across clusters (p = 0.037) and the drug sensitivity cluster remained prognostic after adjusting for Day 42 MRD. Cluster III and IV showed the best survival outcomes in keeping with rapid MRD clearance (Figure 4).
A prognostic analysis of dasatinib sensitivity in T-ALL revealed that dasatinib sensitivity (LC50 < 0.25) was associated with a lower event-free survival (p = 0.026).
Figure 4. Five-year event-free survival across A drug sensitivity clusters (n = 549) and B dasatinib sensitivity groups in T-cell ALL (n = 97)*
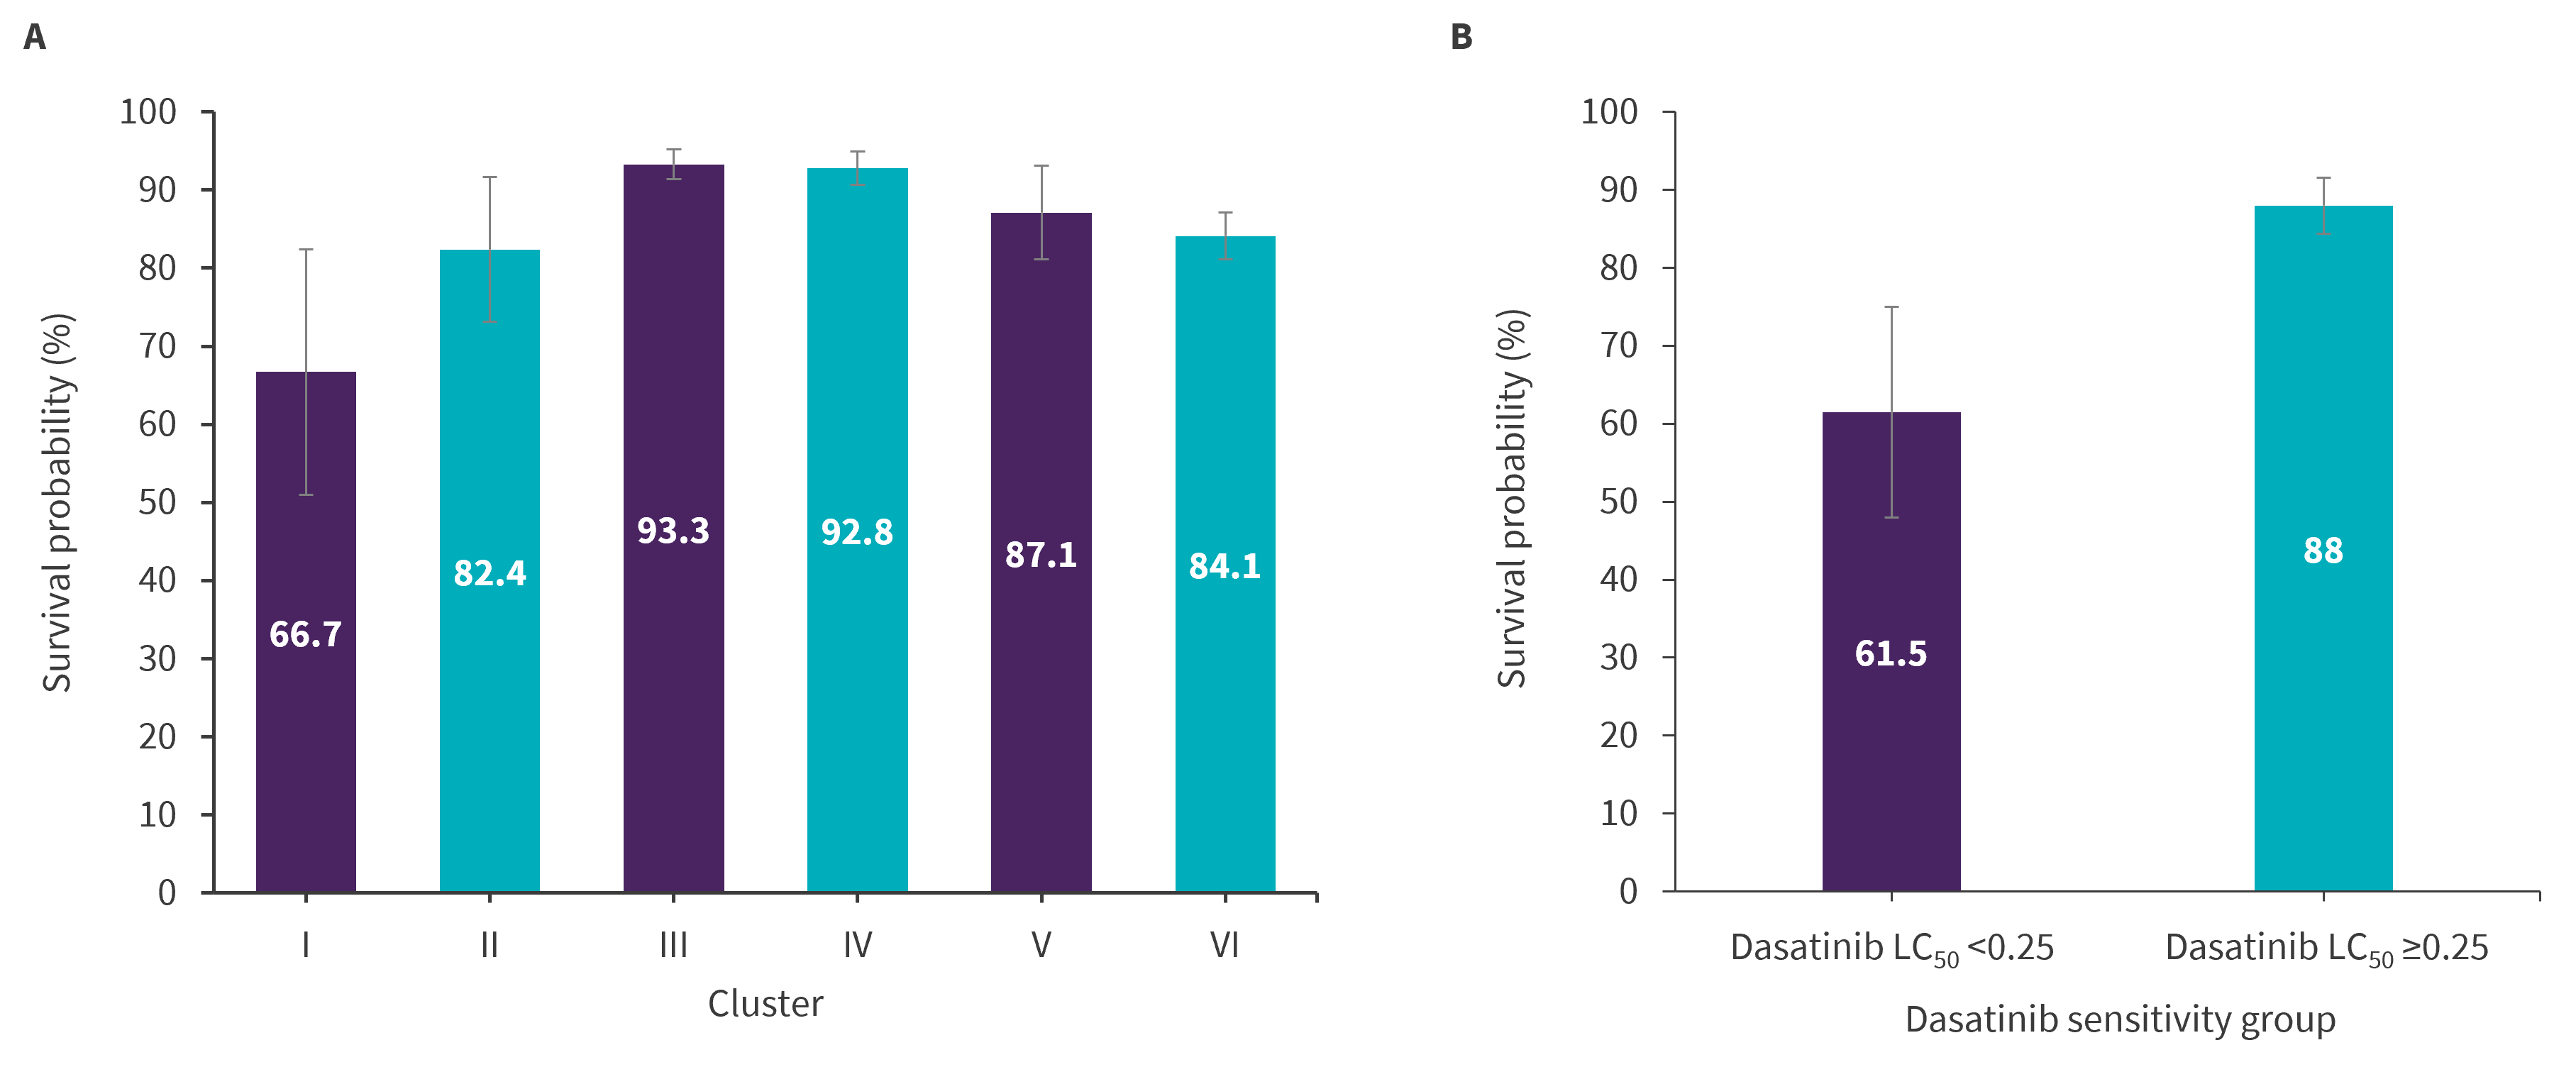
ALL, acute lymphoblastic leukemia; LC50, 50% lethal concentration.
*Adapted from Lee, et al.1
Conclusion1
This study revealed remarkable heterogeneity in ALL drug response, with favorable ALL subtypes exhibiting the greatest sensitivity to L-asparaginase and glucocorticoids. The six identified molecular subtype clusters were strongly associated with event-free survival, even after adjusting for MRD, highlighting their prognostic utility in ALL risk-stratification. Pharmacotyping identified a T-cell ALL subset with poor prognosis that was sensitive to targeted agents, implying alternative therapeutic strategies. Taken together, these results could inform more precise treatment strategies to further improve outcomes in children with ALL.
References
Please indicate your level of agreement with the following statements:
The content was clear and easy to understand
The content addressed the learning objectives
The content was relevant to my practice
I will change my clinical practice as a result of this content
